How much revenue does a live concert generate per attendee?
Revenue per attendee (RPA), also called per-capita spending, is total event revenue divided by the total number of attendees. It captures everything each fan spends across the show, not just the ticket price.
RPA = Total Event Revenue ÷ Total Attendees
That value is generated by the attendee, but captured by different players: the promoter, the ticketing platform, the venue, the F&B concessionaire and the artist, among others.
A major live music tour generates a Revenue Per Attendee (RPA) of roughly $130 to $390+, of which only about half comes from the base ticket. The rest is ancillary revenue: VIP packages, merchandising, food & beverage and digital add-ons. RPA captures the total value each fan generates across the full concert cycle, not just the price on the ticket.
The ticket price tells you almost nothing about what a concert is really worth.
It’s the most visible number in live music: the figure on the sales platform, the one fans argue about, the one the press puts in headlines. And precisely because it’s so visible, it’s a profoundly incomplete indicator. A fan walking into an arena doesn’t make a single purchase decision; they make several, spread across the weeks before the show and concentrated in the three or four hours spent inside the venue.
Revenue Per Attendee (RPA) is the metric I built to capture all of that in one number: the total value each attendee generates across the entire consumption cycle linked to a concert, not just what they paid to get in.
Operational definition
RPA = Base ticket + Δ dynamic pricing + VIP package + Merchandising + Food & Beverage + Digital add-ons
What Revenue Per Attendee actually measures
Traditional industry logic treats the ticket as the lever of a concert’s economics. RPA reframes the question. It stops asking “how much do we charge for the ticket?” and starts asking “how much total value can we capture from every fan who walks through the door?”
That shift matters because the answer is counterintuitive: across a major tour, roughly half of the revenue per fan (often 55–62%) is generated outside the base ticket price. The ticket is not the business. It’s the access layer to a much broader value ecosystem.
RPA is a per-attendee metric on purpose. By normalising everything to a single fan, it lets you compare a stadium night to a theatre residency, a generalist or mainstream pop act to a collector-driven rock band, regardless of venue size. Total gross tells you how big the night was; RPA tells you how well-monetized each relationship is.
The five layers of RPA
The revenue per attendee model
Base ticket. Admission to the show, almost always bought in advance. This layer counts the ticket on its own, before any package is added.
VIP packages. Premium tiers sold on top of admission: better seats, early entry, exclusive items and experiences such as soundcheck access or a meet and greet.
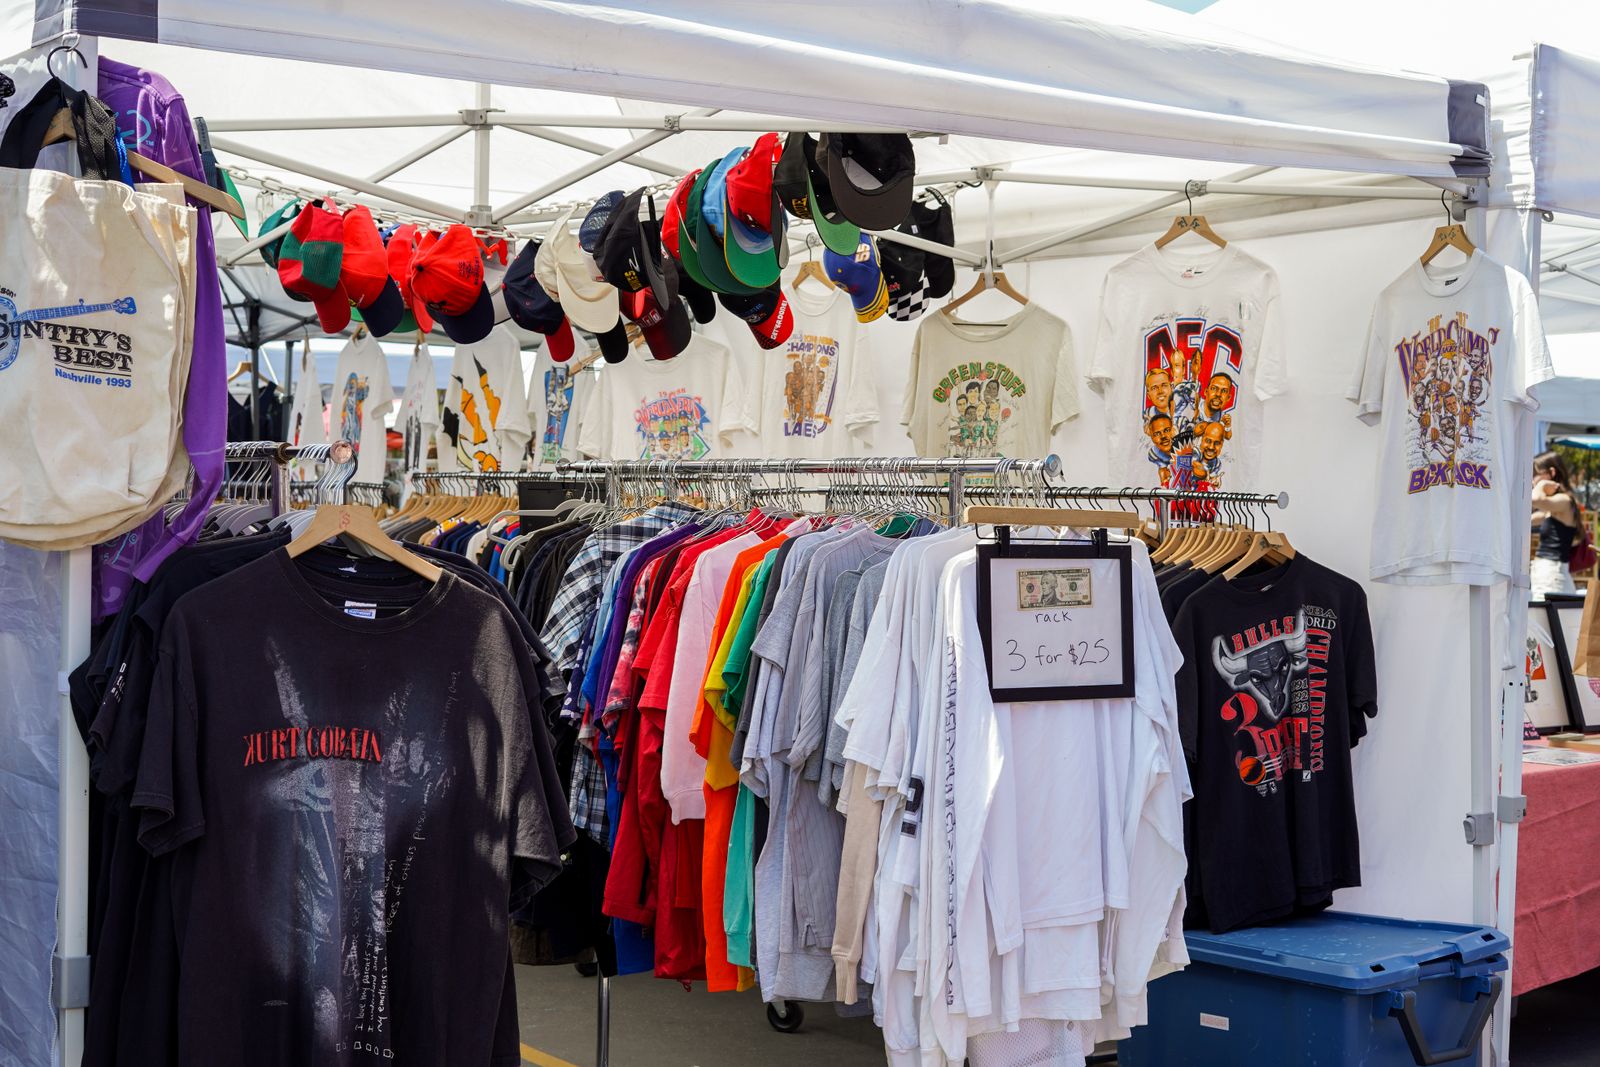
Merchandising. Physical goods at the stand. In many venues a share of the sales stays with the building.
Food & Beverage. Consumed in the room, on the night, and often run by the venue or a concessionaire.
Digital add-ons. Recordings, livestreams and access rights. The only layer that keeps earning after the show.
Every layer is an average across the full house, divided by total attendance rather than by the number of buyers. The layers are not equal in size and any of them can be zero on a given tour. Revenue Per Attendee (RPA) framework © 2026 Oriol Guitart.
The model breaks revenue into five constituent layers. In a case study you see the rolled-up percentages; here is what actually lives inside each one.
1. Base ticket. Face value plus dynamic and platform-driven pricing: zone/tier pricing, premium and “platinum” seating, demand-based adjustments. This is the access layer, necessary, visible, and the easiest to over-index on. In the model, the “average ticket price” is a weighted average across all these zones.
2. VIP packages. The highest-leverage layer. A VIP package is rarely one thing; it bundles meet & greet, early entry, premium parking, exclusive or limited merchandise, lounge access, soundcheck or pre-show experiences, and commemorative laminates. Each component can be priced, tiered and combined.
These tiers escalate steeply and are largely industry-standard: Coldplay’s packages have run from a $1,000 Silver to a $2,400 Meet & Greet, and Rush’s top meet-and-greet tier reached around £2,300 a head on the 2026 tour. The top tiers carry the steepest markups, because bundling lifts perceived value: premium parking that few would buy on its own makes the whole package feel worth more.
Crucially, VIP is a block of inventory carved out of total capacity, sold as a package, not a price zone. Zone pricing (closer = pricier) lives inside the base ticket above; VIP is a separate product sold to a separate slice of the house.
And because the package re-bundles items that also live in other layers (a limited shirt, a drinks tab, parking), you count it once: the package price is the VIP buyer’s total premium spend, not a figure added on top of their merchandise or F&B.
3. Merchandising. Apparel, collectibles, tour-exclusive and limited-run items, programmes. For fan communities with a collector culture, merch is not a souvenir: it’s an identity marker, and spend per head can run multiples above the industry average.
4. Food & Beverage. Concessions, premium bars and packaged offers. Heavily shaped by venue format and by how the show is structured around points of sale (an intermission, for example, is a revenue mechanism, not just a pause).
5. Digital add-ons. High-resolution recordings of the night, livestream access, post-show content, and fan memberships. Marginal cost approaches zero, which makes this the highest-margin layer even when its share of RPA is small.
Try it yourself: drag the five layers and watch RPA move:
Interactive · Estimate your event's RPA
Drag the sliders to model your own live event — Revenue Per Attendee updates in real time.
Average ticket price = weighted average across all non-VIP zones. VIP premium = what a VIP buyer pays above that ticket (VIP being a stock carved out of total capacity).
A simplified estimator. The full calculator adds fan segmentation, scenarios and PDF export.
The boundaries of RPA: what counts and what doesn’t
A metric is only as useful as its edges are clear. This is where RPA earns its rigor and where most “how much does a tour make” estimates go wrong.
What’s inside RPA is revenue that (a) is generated per attendee and (b) the artist and promoter can actually design and control. That’s the five layers above.
What’s deliberately outside:
- Venue parking. A common question, and the answer illustrates the boundary well. Standard parking is typically venue-operator revenue, not the artist’s, and it isn’t cleanly per-attendee (it’s per vehicle). It only enters RPA when it’s bundled into a VIP package as premium parking. As a standalone line, it sits outside.
- Service and facility fees. Part of the ticket transaction, but generally captured by the ticketing platform and venue, not the artist. They modify the price the fan pays, not the value the artist captures.
- Sponsorship and brand activations. Real (often large) revenue, but it’s B2B and tour-level, not per-attendee. Folding it into RPA would break the metric’s logic. It belongs in the tour P&L, not the RPA.
- The secondary market (resale). RPA works exclusively with face value. Resale operates outside the artist’s and promoter’s control and reflects market speculation, not pricing strategy. It’s a powerful indicator of demand, but it is not revenue the tour captures, so it’s excluded from the model.
- Travel and tourism spend. Many fans travel from another city or country for a show (I do it myself), generating real revenue for airlines, hotels and restaurants that would not exist without the concert. That induced impact is real, but quantifying it is a separate problem: flight and hotel prices are dynamic and swing with the dates and the destination city, since a show may or may not fall in peak tourist season. You could count how many fans travel, but a credible economic figure would need very complex, highly conditional modeling, so it stays outside RPA.
Drawing these lines is what separates an analytical metric from a back-of-the-envelope guess.
One more distinction sits inside those lines. The five layers all count as RPA, but they do not all flow to the same pocket: the ticket is typically the promoter’s, food and drink is usually a venue concession, and merchandise is the layer closest to the artist.
Who owns each layer decides who actually benefits from moving it, so the same outcome can be a win for one party and a squeeze for another. The economics of the concert residency works through this layer by layer.
What drives RPA and how it varies by show
RPA is not a fixed number; it’s an elastic one. The variables with the most marginal impact are usually the percentage of fans buying a VIP package and average VIP price. Experience packages are the highest-leverage mechanism in a concert’s revenue architecture, well above, say, doubling average F&B spend.
Other key drivers: fan profile (purchasing power, collector behavior, age and loyalty), venue and format, and scarcity (a reunion, a final tour, a limited residency all shift willingness to pay upward).
A quieter driver hides in the calendar: how far ahead the ticket is bought. The longer the gap between purchase and show, the more the non-ticket layers tend to grow.
Two forces push the same way and are worth separating: the mechanism (a payment made long ago stops feeling like a cost, what behavioral economists call decoupling) and selection (the fans who buy earliest are often the most committed, and would spend heavily regardless). For the promoter, the early sale is mostly a cash-flow gain; for the artist and the venue, it is the on-site layers that quietly expand.
As a rough orientation, RPA tends to land in very different places by show type:
Treat these as orders of magnitude, not forecasts, which is exactly how RPA should be read.
All of this points to the one lever a tour should reach for last: the ticket price itself. When a run sells out, raising the face price looks free, but willingness to pay has a ceiling, and the ticket is the layer the fan feels most. Push it too hard and admiration turns into resentment, as the backlash against dynamic pricing has repeatedly shown.
The precedents are recent: Bruce Springsteen‘s “platinum” tickets spiked to $4,000-5,000 in 2022, and the 2024 Oasis reunion quadrupled in-queue prices until the UK regulator opened an investigation.
The durable growth sits in the softer layers, VIP, merch and experiences, and in the timing above, where value can rise without the fan feeling punished at the door.
RPA applied: a real-tour case study
The framework is easier to grasp with a worked example. I applied the full RPA model (five layers, real verified VIP prices, fan segmentation) to a major 2026 tour and broke down exactly how the numbers stack up.
See it in action: The Revenue Per Attendee Model in Rush’s Tour
Using RPA responsibly
Three honest caveats, because a model that overclaims is worse than no model:
- Revenue is not profit. RPA measures value captured per attendee, not margin. After production, crew, travel and venue splits, the artist often nets a small fraction of the gross. RPA sizes the top line, not the bottom one.
- It’s an estimation framework, not a forecast. Layer shares and ranges are reasoned constructions from heterogeneous sources, not published figures, because the industry guards this data closely.
- Face value only. The gap between face value and resale is a demand signal, not a revenue line.
Used with those boundaries in mind, Revenue Per Attendee is the clearest single lens I know for understanding how live music actually makes money beyond the ticket.
From metric to model: estimate your own RPA
RPA is most useful when you can move the variables and watch the result. I built an interactive tool that breaks any live event into the five layers and recalculates total RPA in real time, so you can test which levers matter most for your event. It’s one of three connected models I’ve built for live-event economics (per-show RPA, multi-night residencies, and the full event P&L), all available below.
© 2026 Oriol Guitart. This article — Revenue Per Attendee (RPA): How Live Music Tours Really Make Money — together with the Revenue Per Attendee (RPA) framework and the Live Event RPA Calculator© model, has been developed by its author, Oriol Guitart. All rights reserved, for the duration and extent established by the applicable intellectual property law. Any reproduction, distribution, public communication and/or transformation, in whole or in part, is strictly prohibited without the author’s express written authorization, and the author must in any case be credited as such in any subsequent use.